 SpotBar

Gold-Silver Ratio Explained: How Stackers Read It
Search for the gold-silver ratio and you get one number with a long history attached to it. On September 25, 2026, an ounce of gold bought about 67 ounces of silver, far below the spike above 120 in March 2020 and inside the 50 to 80 band where the ratio spent much of the modern era. Stackers read that number as a gauge of which metal is relatively expensive, and some of them trade against it. This post explains where the ratio comes from, where it has been, and how far you should trust it.
What the Gold-Silver Ratio Is and How to Compute It
The gold-silver ratio is the price of one troy ounce of gold divided by the price of one troy ounce of silver, and the result is a unit-free number that tells you how many ounces of silver one ounce of gold buys. There's no exchange for it and no official publisher. Trackers just divide live spot quotes as they come in, and the number moves whenever either metal moves, which during market hours is constantly.
It also goes quiet on a schedule you can predict. The LBMA sets its benchmark auctions twice daily for gold, at 10:30 and 15:00 London time, and once at noon for silver, and both metals freeze at the last close over weekends and holidays. A ratio computed from live quotes moves almost nonstop through the trading week, then sits still from Friday evening until Sunday evening, US Eastern time. If you check the ratio on a Saturday morning, you're seeing Thursday's market, and that's worth remembering before you act on a move.
On September 25, 2026, gold traded around $4,255 per troy ounce while silver sat at $63.35, which gives a ratio of roughly 67. The math stays the same in any unit, because the conversions cancel. A ratio computed from per-gram prices in rupees lands on the same 67 as one computed from per-troy-ounce prices in dollars, which is why the ratio works as a common language between markets that quote metals very differently.
Because silver is the more volatile metal, the ratio swings several points in a normal week. A falling ratio usually means silver is outperforming gold, and a rising ratio means the opposite. That is the whole signal. Everything else is interpretation, and the interpretation is where the arguments start.
Where the Ratio Has Been, From 15-to-1 to Above 120
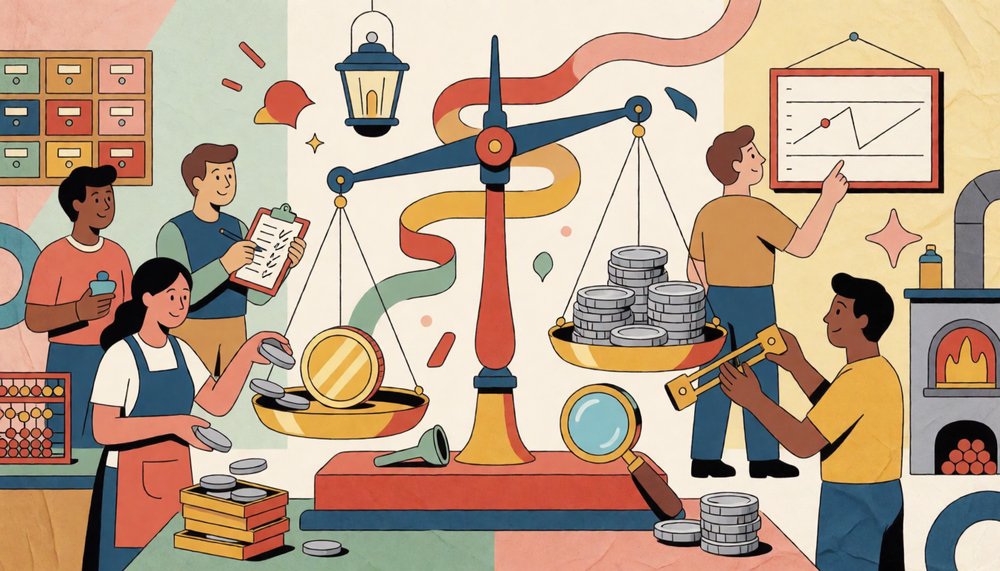
The ancient and classical world ran the ratio at roughly 12 to 15:1 for centuries, and the US Coinage Act of 1792 wrote 15:1 into law for minted coinage. That official linkage died in the nineteenth century, and the twentieth saw the number drift upward as silver lost its monetary role. Since the 1970s the ratio has swung between roughly 15 and 125, spending much of the modern era between 50 and 80.
The extremes are instructive. In March 2020 the ratio spiked above 120:1, its highest recorded level, because silver collapsed harder than gold in the pandemic selloff. Silver itself has traded above $50 per ounce only twice in modern history, in January 1980 and April 2011, and it spent the forty years between those peaks in a band from roughly $5 to $30. A metal that quadrupled inside a few years is the reason the ratio can sit at 67 today and not be low in any lasting sense.
How Stackers Actually Use the Ratio
Above 80:1, stackers read silver as cheap against gold. Below 50:1, they read gold as the better value of the two. These thresholds are conventions, not laws, but they convert into concrete price levels fast. With gold at $4,255, an 80:1 ratio implies silver around $53, and a 50:1 ratio implies silver around $85. When silver trades far from those implied levels, stackers who follow the ratio accumulate the metal the ratio calls cheap and rotate back toward the other one when the number crosses the band again.
The rotations are measured in metal, not currency. The point of trading the ratio is to end up holding more ounces over time, not more dollars, because dollars are the thing both metals are supposed to protect you from. In practice that means buying silver when the ratio is high, then swapping back into gold only after the ratio has fallen for months or years. Roughly half or more of annual silver demand is industrial, so the ratio also tells you whether the market is pricing silver as money or as a commodity input, and those two regimes produce very different behavior.
Why the Ratio Does Not Have to Come Back Down
Mean reversion is a tendency observed across decades, not a law, and the ratio can stay extreme for years. The wholesale silver market is roughly one-tenth the size of the gold market by dollar value, which is why silver swings wider and the ratio can move several points in a week in either direction. A high ratio is not a stretched rubber band with a scheduled snap. It is a price relationship between two markets, and neither market owes your timeline anything.
Industrial demand cuts both ways. A recession can crush silver's industrial side while gold holds as a monetary asset, which pushes the ratio higher even when both metals are falling. Anyone rotating on the ratio is making a relative bet with no fixed payoff date, so it deserves to be sized like an opinion, not an arbitrage. Treat 80:1 and 50:1 as context for a decision you would defend anyway, not as a signal that fires on its own.
Frequently Asked Questions
What is a good gold-silver ratio right now?
There is no official good level. On September 25, 2026, gold was around $4,255 per troy ounce and silver around $63.35, for a ratio near 67:1, which sits inside the 50 to 80 band where the ratio spent much of the modern era. Most stackers call silver cheap against gold above 80:1 and call gold the better value below 50:1, and they treat everything in between as context rather than signal.
How do I calculate the gold-silver ratio myself?
Divide the current price of one troy ounce of gold by the price of one troy ounce of silver. You don't need an account, a subscription or a special feed, because any spot quote for each metal works. The result is unit-free, so gram prices and kilo prices give the same number.
What was the highest gold-silver ratio in history?
The highest recorded extreme came in March 2020, when the ratio spiked above 120:1 as silver collapsed harder than gold in the pandemic selloff. The lowest sustained levels belong to the bimetallic era, when law fixed the ratio at 15:1 and markets traded near it for long stretches.
Is a high ratio good for silver stackers?
It's the condition stackers who trade the ratio wait for, because above 80:1 silver is cheap against gold by convention. The catch is that nobody knows how long the condition lasts, and silver's industrial side can keep a high ratio in place through a weak economy. A high ratio is an argument for accumulating silver, and it isn't a promise about what happens next.
Does the ratio work in grams or kilos instead of troy ounces?
Yes. The ratio is a division of two prices expressed in the same unit, so whatever conversion you apply to gold you also apply to silver, and it cancels. A troy ounce is 31.1035 grams, but you never need that number for the ratio itself, only for converting the underlying prices.
If you want the gold-silver ratio without doing the division yourself, SpotBar shows gold and silver side by side in your Mac or Windows menu bar, refreshed hourly while markets are open. The gold-only dollar version is free to download, and Pro adds silver, platinum, and palladium in five currencies with no subscription and no account.